Commercial Energy Bills Explained: How Behind-The-Meter Energy Storage Can Help You Lower Costs

As utilities continue to update their rate plans to keep up with a changing power grid, more and more businesses are subject to time-of-use (TOU) utility bills. In addition to minimal fixed charges, these bills are divided into two major categories: energy consumption charges ($/kWh) and demand charges ($/kW). In this blog post, we will explain the differences between these two types of charges. Then, we will describe how energy storage is used to lower energy bills by walking through a model of Axiom’s Virtual Battery service operating at a supermarket over a typical summer month. Finally, we will compare the cost and performance of the Virtual Battery to an equivalent lithium-ion battery system at the same supermarket to show that Axiom’s Virtual Battery can provide the same benefits as a lithium-ion battery at a fraction of the cost.
Explaining Commercial Time-of-Use Utility Bills
As mentioned above, businesses with time-of-use energy bills are subject to both energy consumption and demand charges, both of which vary depending on the time of day, the season, and whether it is a weekend or holiday. In general, demand charges reflect the fixed generation, transmission, and distribution costs on the utility for providing a given level of power to each customer, while energy charges reflect the variable portion of those costs as customers consume the available electricity in real time.
Energy consumption charges are based on the total amount of energy consumed over a billing period, which typically lasts about a month. You can calculate your energy consumption charges by multiplying the amount of energy consumed (kWh) during each TOU period (usually On-Peak, Part-Peak, and Off-Peak) by the relevant price of energy ($/kWh) for each 15-minute interval during the entire billing period.
Demand charges, on the other hand, are based on the maximum amount of power drawn for each TOU period during the billing period. You can calculate demand charges by multiplying the maximum power draw (kW) for each TOU period - typically over 15-minute intervals - by the relevant demand charge ($/kW). Demand charges are often further divided into non-coincident demand charges, which apply to the maximum recorded demand during the entire billing period, and time-related demand charges, which apply to the maximum recorded demand during each time-of-use period.
To better illustrate how energy and demand charges are calculated, below is a summary of Pacific Gas & Electric’s (PG&E’s) E-19 rate plan (as of 03/01/2019), which applies to commercial customers in PG&E territory with maximum demands between 500 and 1,000 kW, and can voluntarily apply to customers with maximum demands less than 500 kW.

Note: Weekdays and holidays are subject to Off-Peak charges during all hours.
In particular, take note of the difference between On-Peak and Part-Peak prices for both energy and demand charges. The large difference in demand charges from On-Peak to Part-Peak, most pronounced in the summer season, creates an arbitrage opportunity that will come up later in this post when we discuss how energy storage can be used to lower utility bills. To describe in more detail how bills are calculated, the plot below is the actual load profile of a supermarket subject to the E-19 rate plan during an entire summer billing period.

The total energy consumption is represented by the area under this load profile, and, as mentioned above, the total energy consumption charge can be calculated by multiplying the energy consumed during each 15-minute interval by the relevant TOU energy price; for this billing period, this results in a total energy cost of $15,338.40.
Demand charges are slightly easier to calculate, in that you don’t need to tally up every kWh of energy consumed during the billing period. In this example, the maximum 15-minute demand of the billing period was 283.2 kW, which occurred on September 07 at 5:00PM. Because this maximum demand occurred during the On-Peak period (12:00PM-6:00PM on weekdays), it determines both the On-Peak and Non-Coincident demand charges. The maximum demand during Part-Peak periods of this month (8:30AM-12:00PM and 6:00PM-9:30PM on weekdays) was 278.4 kW, which occurred on September 07 at 7:15PM. Therefore, the total demand charge for this month can be calculated using prices from the table above as follows:

Finally, it is worth noting that, during this billing period, demand charges made up 46% of the variable portion of this customer’s utility bill! Think about that: roughly half of the bill is determined from just a few 15 minute intervals of power consumption. In fact, in some summer months at this site, demand charges are higher than energy consumption charges. Moreover, because supermarket loads are relatively stable and do not tend to have large, short peaks in building load (refrigeration systems must operate 24/7), demand charges can comprise even higher portions of utility bills for certain customers.
How Energy Storage Lowers Energy Bills
As alluded to above, the difference in energy costs and demand charges between TOU periods allows behind-the-meter energy storage to provide value for commercial customers. To demonstrate how this value is created, we will show how Axiom's Virtual Battery, an app powered by Axiom Cloud's IoT Platform, allows customers to lower their utility bills by reducing demand charges and shifting energy consumption away from higher-cost periods.
By intelligently pre-cooling and load-shedding a supermarket’s low-temperature refrigeration system, Virtual Battery uses artificial intelligence (AI) to provide all of the benefits of behind-the-meter energy storage, without the expensive battery hardware that typically comes with it. The plot below shows how Virtual Battery changes the load profile of the same supermarket during the same billing period as in the example above (3-hour moving averages shown for readability).

Because Virtual Battery is able to pre-cool (charge) the low-temperature refrigeration system during times of lower building load and intelligently load-shed (discharge) to prevent peaks, both energy and demand charges are lower than they were in the baseline case. Outdoor air temperature, shown in red, along with many other factors both internal and external to the supermarket are used to predict building peaks; these forecasts are what allow the IoT Platform to command load-shed at optimal times.
By understanding the utility rate plan, forecasting building load based on a multitude of factors, and charging and discharging in an intelligent manner, Virtual Battery is able to prevent building load peaks that would have occurred without the service. During this billing period, Virtual Battery reduced this customer’s On-Peak and Non-Coincident demand threshold from 283.2 kW to 242.3 kW and reduced the Part-Peak demand threshold from 278.4 kW to 242.3 kW. Therefore, the total demand charge savings for the billing period can be calculated as follows:

Note: 15min demand thresholds not visible on graph above because of moving averages.
In addition to reducing demand charges by $1,866.20, Virtual Battery also saved this customer $53.59 during this billing period by shifting energy consumption from On-Peak periods to less expensive Part- and Off-Peak periods. These savings on energy charges are possible despite a round-trip efficiency of less than 100%, which is due to the fact that the refrigeration system requires proportionally more energy to keep the display cases at a lower temperature than at the standard set point. However, with a higher round-trip efficiency, these savings could be increased even further.
For further detail of Virtual Battery operation, the plot below contains a subset of the same data in full 15-minute resolution during the hottest day of the month, which corresponded to the month’s highest baseline building loads.

As shown above, Virtual Battery “charges” the low-temperature (LT) system during the Off-Peak and Part-Peak periods by lowering its temperature below its standard -22oF set point, which has no negative impact on the contents of individual display cases on the sales floor. Then, during the On-Peak period and second Part-Peak period, when it is the hottest outside and the building would otherwise set a new monthly demand threshold, Virtual Battery “discharges” by intelligently shutting off refrigeration compressors and condensers, thereby allowing the system to return to its original setpoint.
Finally, Virtual Battery also allows this customer to participate in California ISO’s demand response program, which provides qualifying PG&E customers the ability to capture annual revenue for each kW of flexible capacity. If Virtual Battery were to operate at this supermarket for an entire year, models using the past 12 months of actual building and refrigeration data suggest that this customer would see energy bill management savings of about $16,600 and demand response revenues of about $3,300.
Altogether, Axiom’s Virtual Battery service will provide the customer $19,900 of value per year from energy bill management and demand response - all because they are on a time-of-use rate plan!
Comparing Virtual Battery to Lithium-Ion Batteries
Any behind-the-meter energy storage system will allow customers to benefit from multiple value streams, including cost savings from reduced utility bills and new revenue streams through participation in grid services programs such as demand response. However, for facilities with large low-temperature refrigeration loads, Virtual Battery can provide these benefits at a much lower cost by combining Artificial Intelligence and the Internet of Things with our deep expertise in the refrigeration industry. To illustrate this point, we used Energy Toolbase to model the performance of a lithium-ion battery system over 12 months at the same supermarket as in the analysis above, and found that it would require a 52kW/104kWh battery to generate the same annual savings as the Virtual Battery service. The modeled operation of a lithium-ion system over the same September billing period is shown below (3-hour moving averages shown for readability).

According to modeling in Energy Toolbase, this 52kW/104kWh lithium-ion battery would generate $1,977 in demand charge savings over this billing period - only $111 more than the $1,866 that would be generated by the Virtual Battery. However, also according to Energy Toolbase, a lithium-ion system of this size would cost $130,981 - an order of magnitude more expensive than an installation of Axiom Cloud’s IoT Platform would be at the same site! The calculation of demand charge savings from the lithium-ion battery can be seen below - note how similar the magnitudes are to the Virtual Battery savings calculated in the previous section.

Note: 15min demand thresholds not visible on graph above because of averaging for readability
Over the course of 12 months, Energy Toolbase’s models suggest that a 52kW/104kWh lithium-ion battery would generate $16,674 in energy bill savings, compared to $16,604 from Virtual Battery. While they generate very similar amounts of energy bill savings, there are quite a few differences between these two solutions. To conclude this discussion, the table below shows some of the advantages and disadvantages of Virtual Battery and lithium-ion batteries.
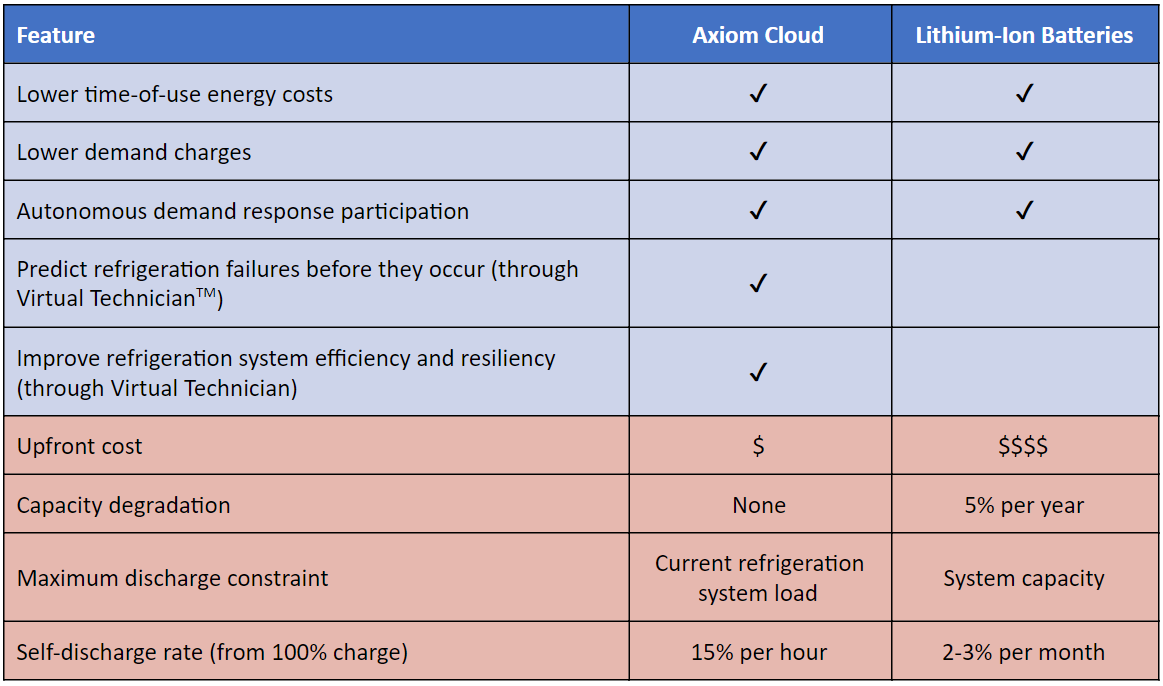
While either of these two solutions may be the correct one for your business, we hope to have sufficiently explained the commercial time-of-use energy bill and demonstrated how energy storage can help reduce the costs associated with it. If you have a commercial refrigeration system and are looking to lower demand charges while reducing maintenance costs and failures of mission-critical refrigeration equipment, please reach out today!
Turner is an Application Engineer at Axiom Cloud Inc.
Axiom Cloud Inc. uses Artificial Intelligence to transform the world’s thermal systems into intelligent, flexible, and resilient assets. If you’re interested in learning more about our team or our Virtual Battery and Virtual Technician apps, contact us today.